Monetary Metals gives a peek into how we view the precious metals space and what key indicators and price drivers to look out for in 2022.
This is a brief of our annual analysis of the gold and silver markets. In the full Outlook Report, we take an in-depth look at the market players, dynamics, fallacies, drivers, and finally give our predictions for gold and silver prices over the coming year.
Our unique analysis of precious metals, encapsulated in our Supply and Demand model, is a true signal in an otherwise very noisy market. It has achieved over 75% accuracy in predicting future price moves over the last decade.
So, how exactly do we do it?
How We Think About Gold
Gold and silver cannot be understood by conventional commodity analysis.
This is because virtually all of the gold ever mined in human history is still in human hands (to a lesser extent for silver). No other commodity comes even remotely close. The World Gold Council estimates this to be about 201,296 tons. That’s over 6 billion ounces, and just shy of $12 trillion dollars (as of this writing).
We think this number underestimates it, potentially by multiples.
Why?
For two reasons. Humans have been accumulating gold for a very, very long time.
Second, gold isn’t exactly the kind of thing people mention that they have.
The implications of this are extraordinary.
It means there’s no such thing as a glut in gold. And there’s no such thing as oversupply. People are happy to keep stacking gold today, and for all the “today’s” going back thousands of years.
All of the above ground gold that humans have been accumulating for millennia is potential supply, under the right conditions and at the right price.
Unlike with ordinary commodities, virtually everyone on the planet represents potential demand. People are happy to accept the 1,001st ounce on the same terms as the 1,000th or the 1st ounce.
What could account for this kind of behavior over millennia? There is only one conceivable answer.
It’s because these metals are money.
This leads us to conclude that a change in the desire to hoard or dishoard gold, even a small one, is the primary driver of the price.
How then does one measure the desire to hoard or dishoard gold?
The answer to this question forms the basis of our Supply and Demand model for gold and silver.
How We Analyze the Gold Market
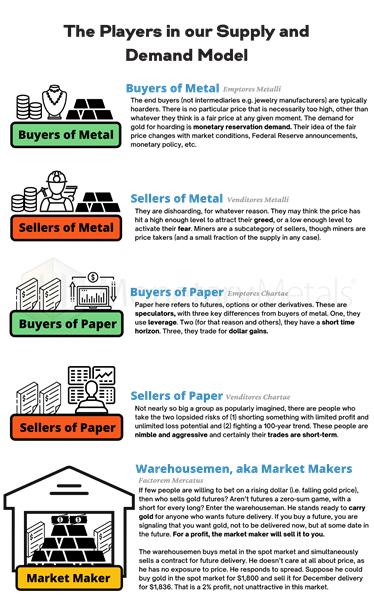
The market is composed of 5 different primary groups: buyers of metal, sellers of metal, buyers of paper, short sellers of paper, and market makers (warehousemen).
Despite the fact that virtually all of the gold ever mined is still in someone’s possession, the market can experience seasons of relative abundance and scarcity. The spreads of the warehouseman provide a good signal to see them.
Normally, the price of a contract to deliver gold in the future is above the price of gold for immediate delivery. If this spread—future minus spot—is wide and getting wider, there is an abundance of gold to the market. And the reverse is true, if it is narrow, or even inverted, then there is scarcity in the market.
Relative abundance indicates a soft market, and likely precedes a falling price. Relative scarcity indicates a stronger market, and typically precedes a rising price. We publish more on our theory and model, in our full Outlook Report.


